Absolute deviation
In statistics, the absolute deviation of an element of a data set is the absolute difference between that element and a given point. Typically the point from which the deviation is measured is a measure of central tendency, most often the median or sometimes the mean of the data set.
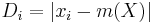
where
- Di is the absolute deviation,
- xi is the data element
- and m(X) is the chosen measure of central tendency of the data set—sometimes the mean (
 ), but most often the median.
Contents |
Measures of dispersion
Several measures of statistical dispersion are defined in terms of the absolute deviation.
Average absolute deviation
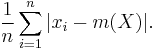
The average absolute deviation, or simply average deviation of a data set is the average of the absolute deviations and is a summary statistic of statistical dispersion or variability. It is also called the mean absolute deviation, but this is easily confused with the median absolute deviation.
The average absolute deviation of a set {x1, x2, ..., xn} is
The choice of measure of central tendency,  , has a marked effect on the value of the average deviation. For example, for the data set {2, 2, 3, 4, 14}:
| Measure of central tendency |
Average absolute deviation |
|---|---|
| Mean = 5 | 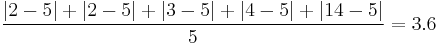 |
| Median = 3 | 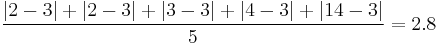 |
| Mode = 2 | 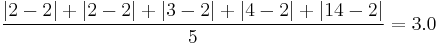 |
The average absolute deviation from the median is less than or equal to the average absolute deviation from the mean. In fact, the average absolute deviation from the median is always less than or equal to the average absolute deviation from any other fixed number.
The average absolute deviation from the mean is less than or equal to the standard deviation; one way of proving this relies on Jensen's inequality.
For the normal or "Gaussian" distribution, the ratio of mean absolute deviation to standard deviation is  . Thus if X is a normally distributed random variable with expected value 0 then
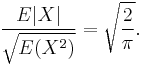
In other words, for a Gaussian, mean absolute deviation is about 0.8 times the standard deviation.
Mean absolute deviation
The mean absolute deviation (MAD), also referred to as the mean deviation, is the mean of the absolute deviations of a set of data about the data’s mean. In other words, it is the average distance of the data set from its mean during certain number of time periods.
The equation for MAD is as follows:
MAD = 1/n ∑(|ei|) , where ei = Fi - Di
This method forecast accuracy is very closely related to the mean squared error (MSE) method which is just the average squared error of the forecasts. Although these methods are very closely related MAD is more commonly used because it does not require squaring.
The equation for MSE is as follows:
MSE = 1/n Σ(ei2) , where ei = Fi - Di
Median absolute deviation (MAD)
The median absolute deviation is the median of the absolute deviation from the median. It is a robust estimator of dispersion.
For the example {2, 2, 3, 4, 14}: 3 is the median, so the absolute deviations from the median are {1, 1, 0, 1, 11} (reordered as {0, 1, 1, 1, 11}) with a median of 1, in this case unaffected by the value of the outlier 14, so the median absolute deviation (also called MAD) is 1.
Maximum absolute deviation
The maximum absolute deviation about a point is the maximum of the absolute deviations of a sample from that point. It is realized by the sample maximum or sample minimum and cannot be less than half the range.
Minimization
The measures of statistical dispersion derived from absolute deviation characterize various measures of central tendency as minimizing dispersion: The median is the measure of central tendency most associated with the absolute deviation, in that
- L2 norm statistics
- just as the mean minimizes the standard deviation,
- L1 norm statistics
- the median minimizes average absolute deviation,
- L∞ norm statistics
- the mid-range minimizes the maximum absolute deviation, and
- trimmed L∞ norm statistics
- for example, the midhinge (average of first and third quartiles) which minimizes the median absolute deviation of the whole distribution, also minimizes the maximum absolute deviation of the distribution after the top and bottom 25% have been trimmed off.
Estimation
The mean absolute deviation of a sample is a biased estimator of the mean absolute deviation of the population. In order for the absolute deviation to be an unbiased estimator, the expected value (average) of all the sample absolute deviations must equal the population absolute deviation. However, it does not. For the population 1,2,3 the population absolute deviation is 2/3. The average of all the sample standard deviations of size 3 that can be drawn from the population is 40/81. Therefore the absolute deviation is a biased estimator.
See also
- Deviation (statistics)
- Errors and residuals in statistics
- Least absolute deviations
- Loss function
- Median absolute deviation
- Squared deviations
External links
|
|||||||||||||||||||||||||||||||||||||||||||||||||||||||||||||||||||||||||||||||||||||||||||||||||||||||||||||||||||||||||||||||||||||||||||